4 November 2024
Empowering Decision-Making: The Smartsheet and Power BI Integration
Empowering Decision-Making: The Smartsheet and Power BI Integration
In today’s data-driven landscape, organizations rely heavily on clear, actionable insights to stay competitive. The integration of Smartsheet with Power BI is a powerful combination that enables businesses to transform raw data into valuable, visual insights that support strategic decision-making. This article explores the benefits and applications of integrating these tools, and how it can drive better business outcomes.
Before the advent of advanced data analytics, businesses often operated reactively, relying heavily on manual methods for data management and decision-making. In addition, for many years, decision-makers, like many people, relied on intuition or “gut feelings” to guide choices—a practice rooted in a basic sense of what felt right or wrong (Stobierski, Harvard Online Business Insights, 2019). However, in the modern data-driven world, relying solely on gut instinct lacks the predictive accuracy required for effective decision-making. The sheer volume of information that must be processed is enormous, and without proper analysis, this can lead to costly mistakes with significant consequences for a company.
This modern landscape demands a precise and comprehensive understanding of complex data, making accurate data collection and reporting essential. Traditional manual processes of data collection have become not only time-consuming but also inadequate. Moreover, many companies continue to struggle with limited data visibility and inefficient trend analysis, often because they rely on suboptimal visualization methods or overcomplicate their visuals with excessive data. Such practices can lead to misleading interpretations and flawed conclusions, ultimately impairing business decisions (Oracle, 2024).
As businesses face increasing complexity and competition,data analytics and visualization have become cornerstones of effective decision-making. However, true data visualization goes beyond basic charts and graphs; it’s about revealing insights that lead to impactful actions. When data is carefully processed and visualized, it becomes a powerful resource in today’s competitive environment. For instance, MIT Sloan’s research reveals that companies using data-driven decision-making are 5% more productive and 6% more profitable (Psico Smart, 2024). Similarly, McKinsey found that organizations that fully harness data can boost their operating margins by up to 60% (McKinsey, 2011), while PwC reports that data-driven companies are three times more likely to achieve substantial improvements in decision-making (PwC, 2016).
In this context, the integration of Smartsheet and Power BI stands out as a strategic asset, enabling companies to streamline data analysis, uncover trends, and make informed, timely decisions. In other words, with effective data visualization, companies can:
Break down silos,
Accelerate decision-making, and
Uncover crucial trends.
How AMX Maximizes Smartsheet and Power BI Integration
To gain meaningful insights from data, it’s essential to have the right platforms to process and visualize that data —but knowing the best methods to leverage them is equally critical. At AMX, our experts are dedicated to plan, capture, manage, process, automate and report work at scale. This expertise enables AMX to effectively guide clients in maximizing the integration of Smartsheet and Power BI, offering not only technical support but also deeper insights that drive smarter decision-making. As a result, AMX has developed three powerful use cases where this integration can unlock profitable insights for your organization.
Project Oversight
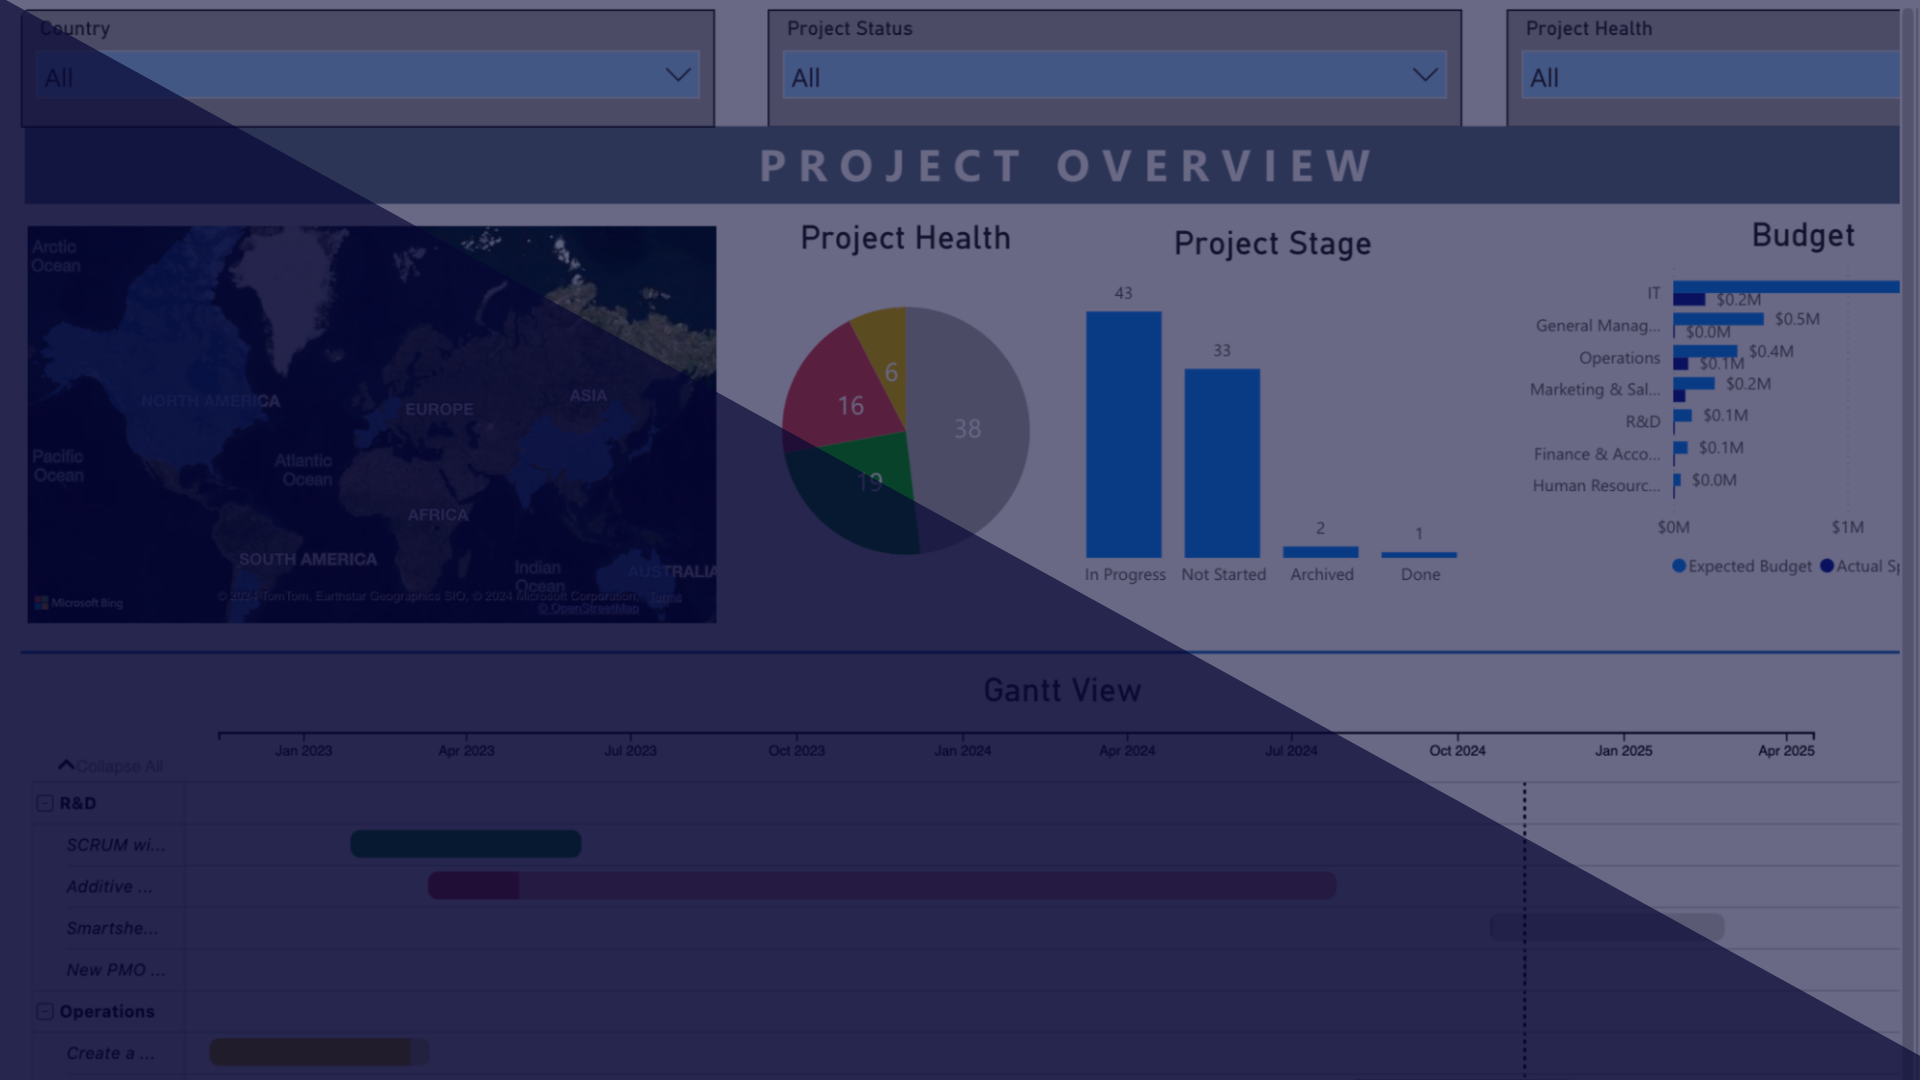
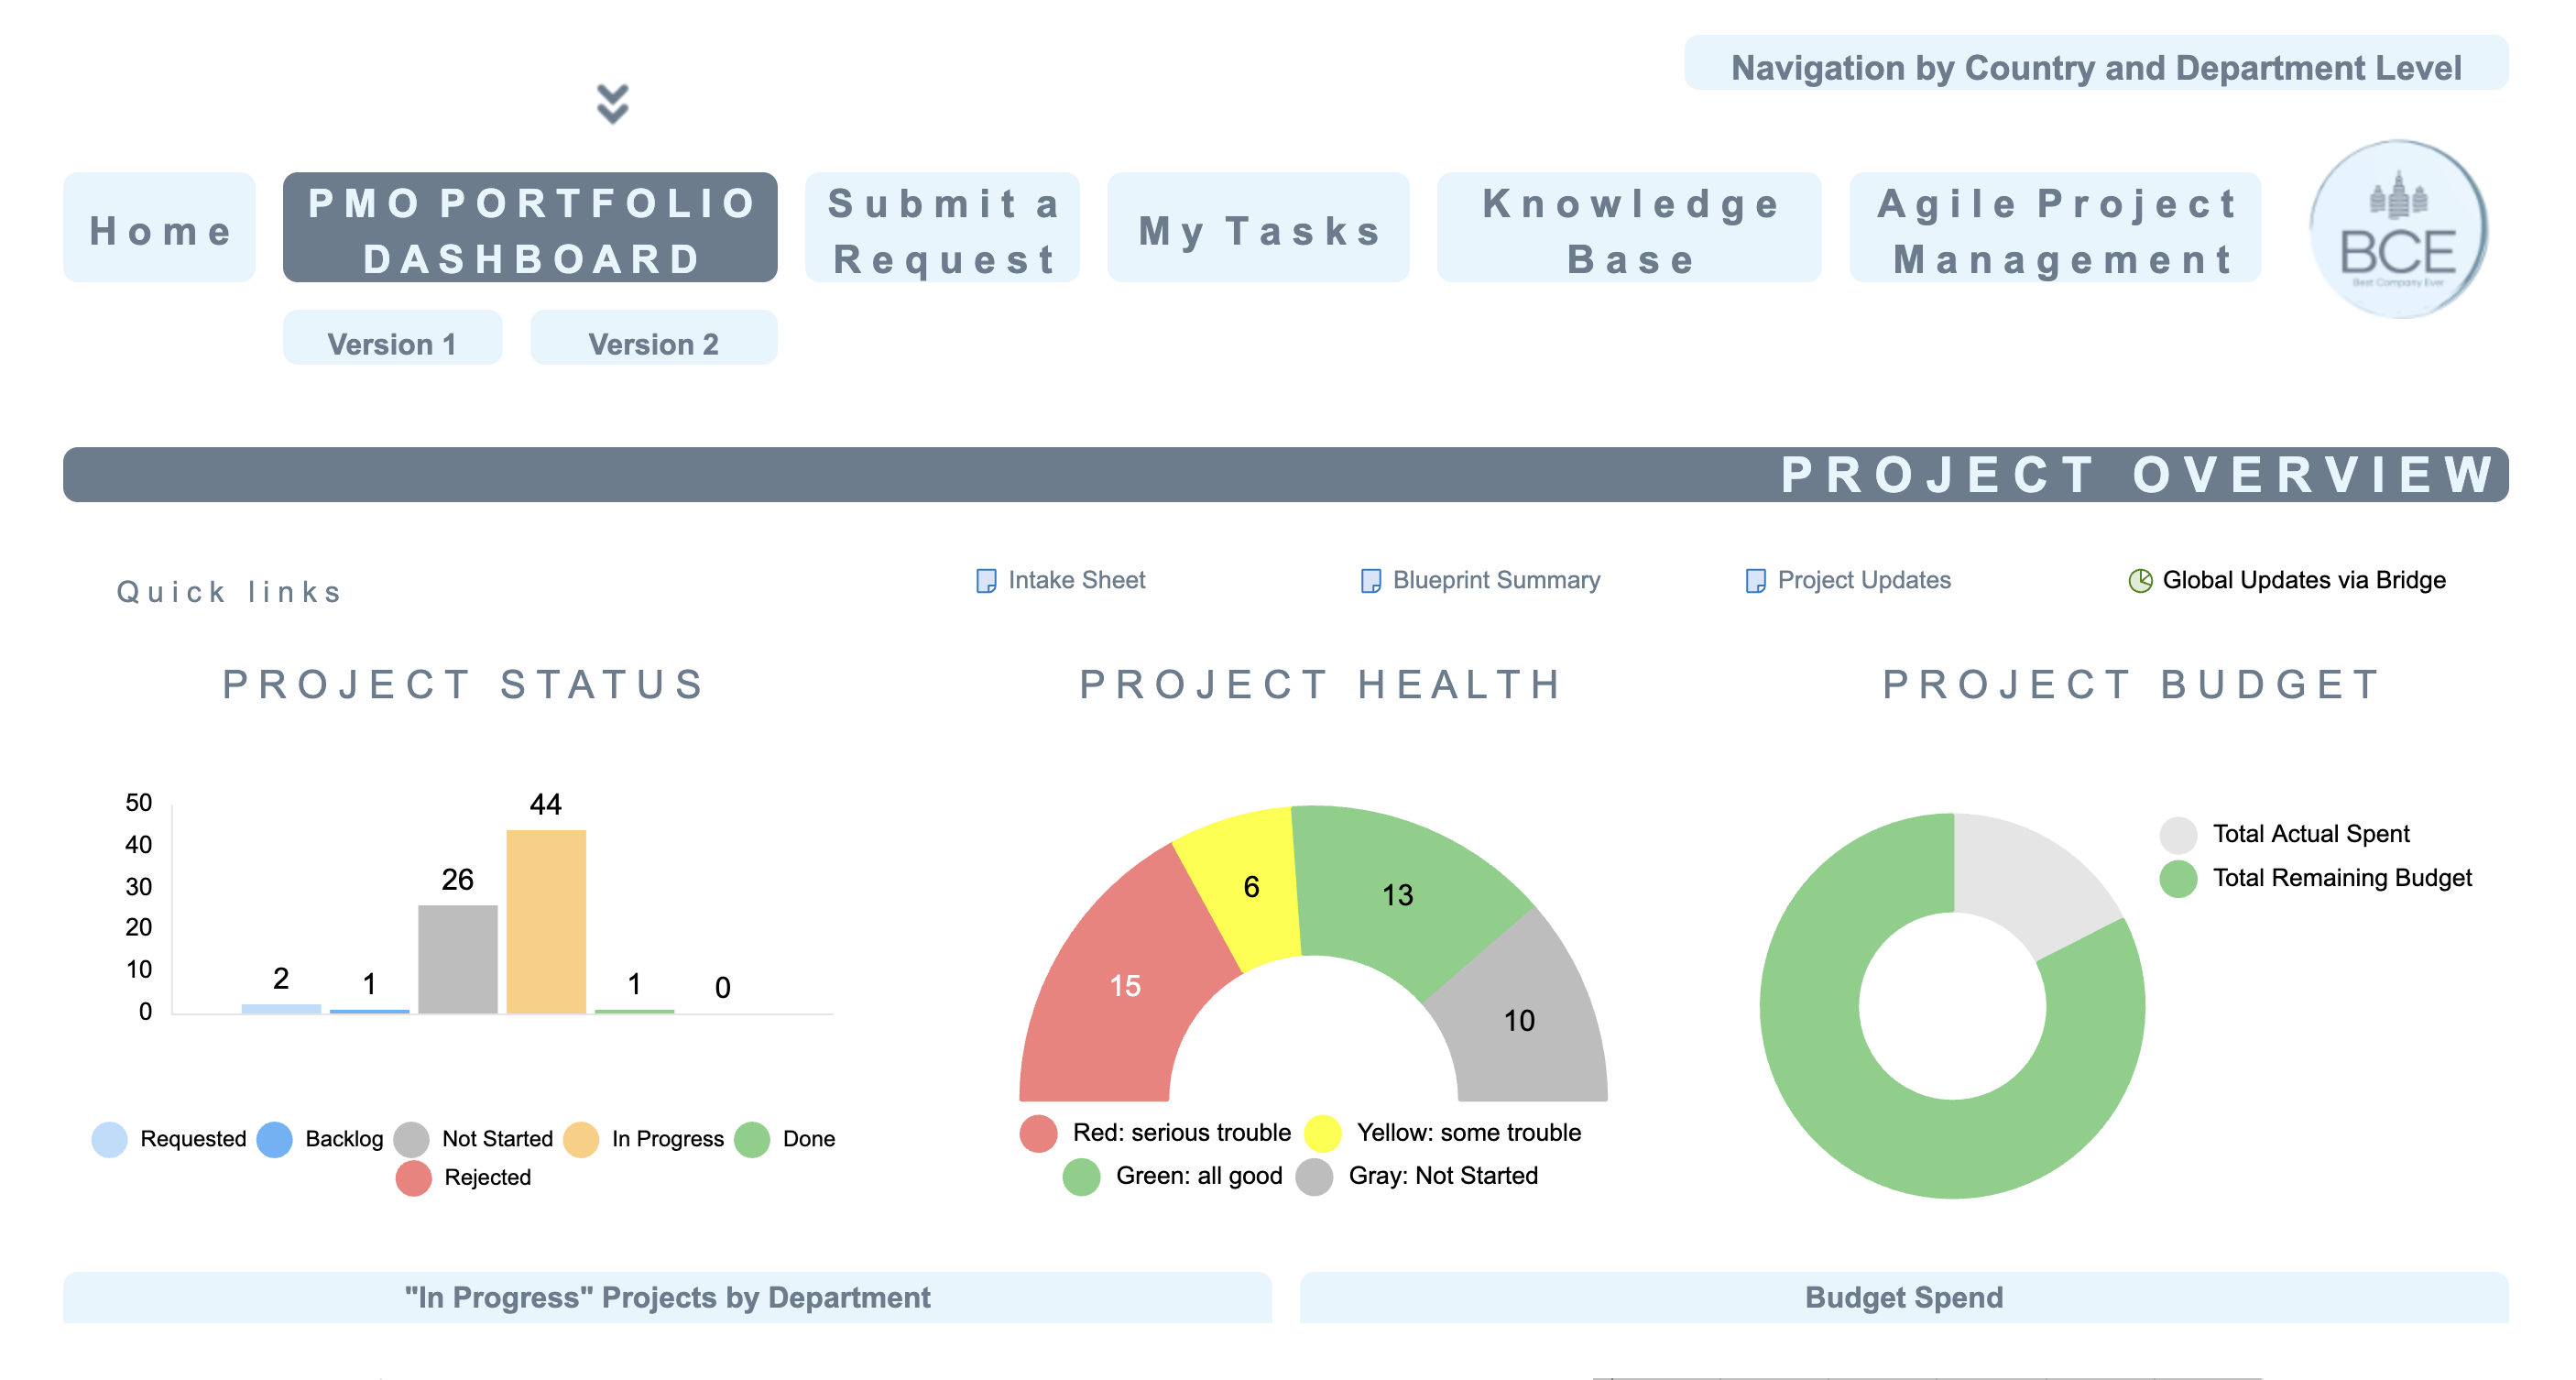
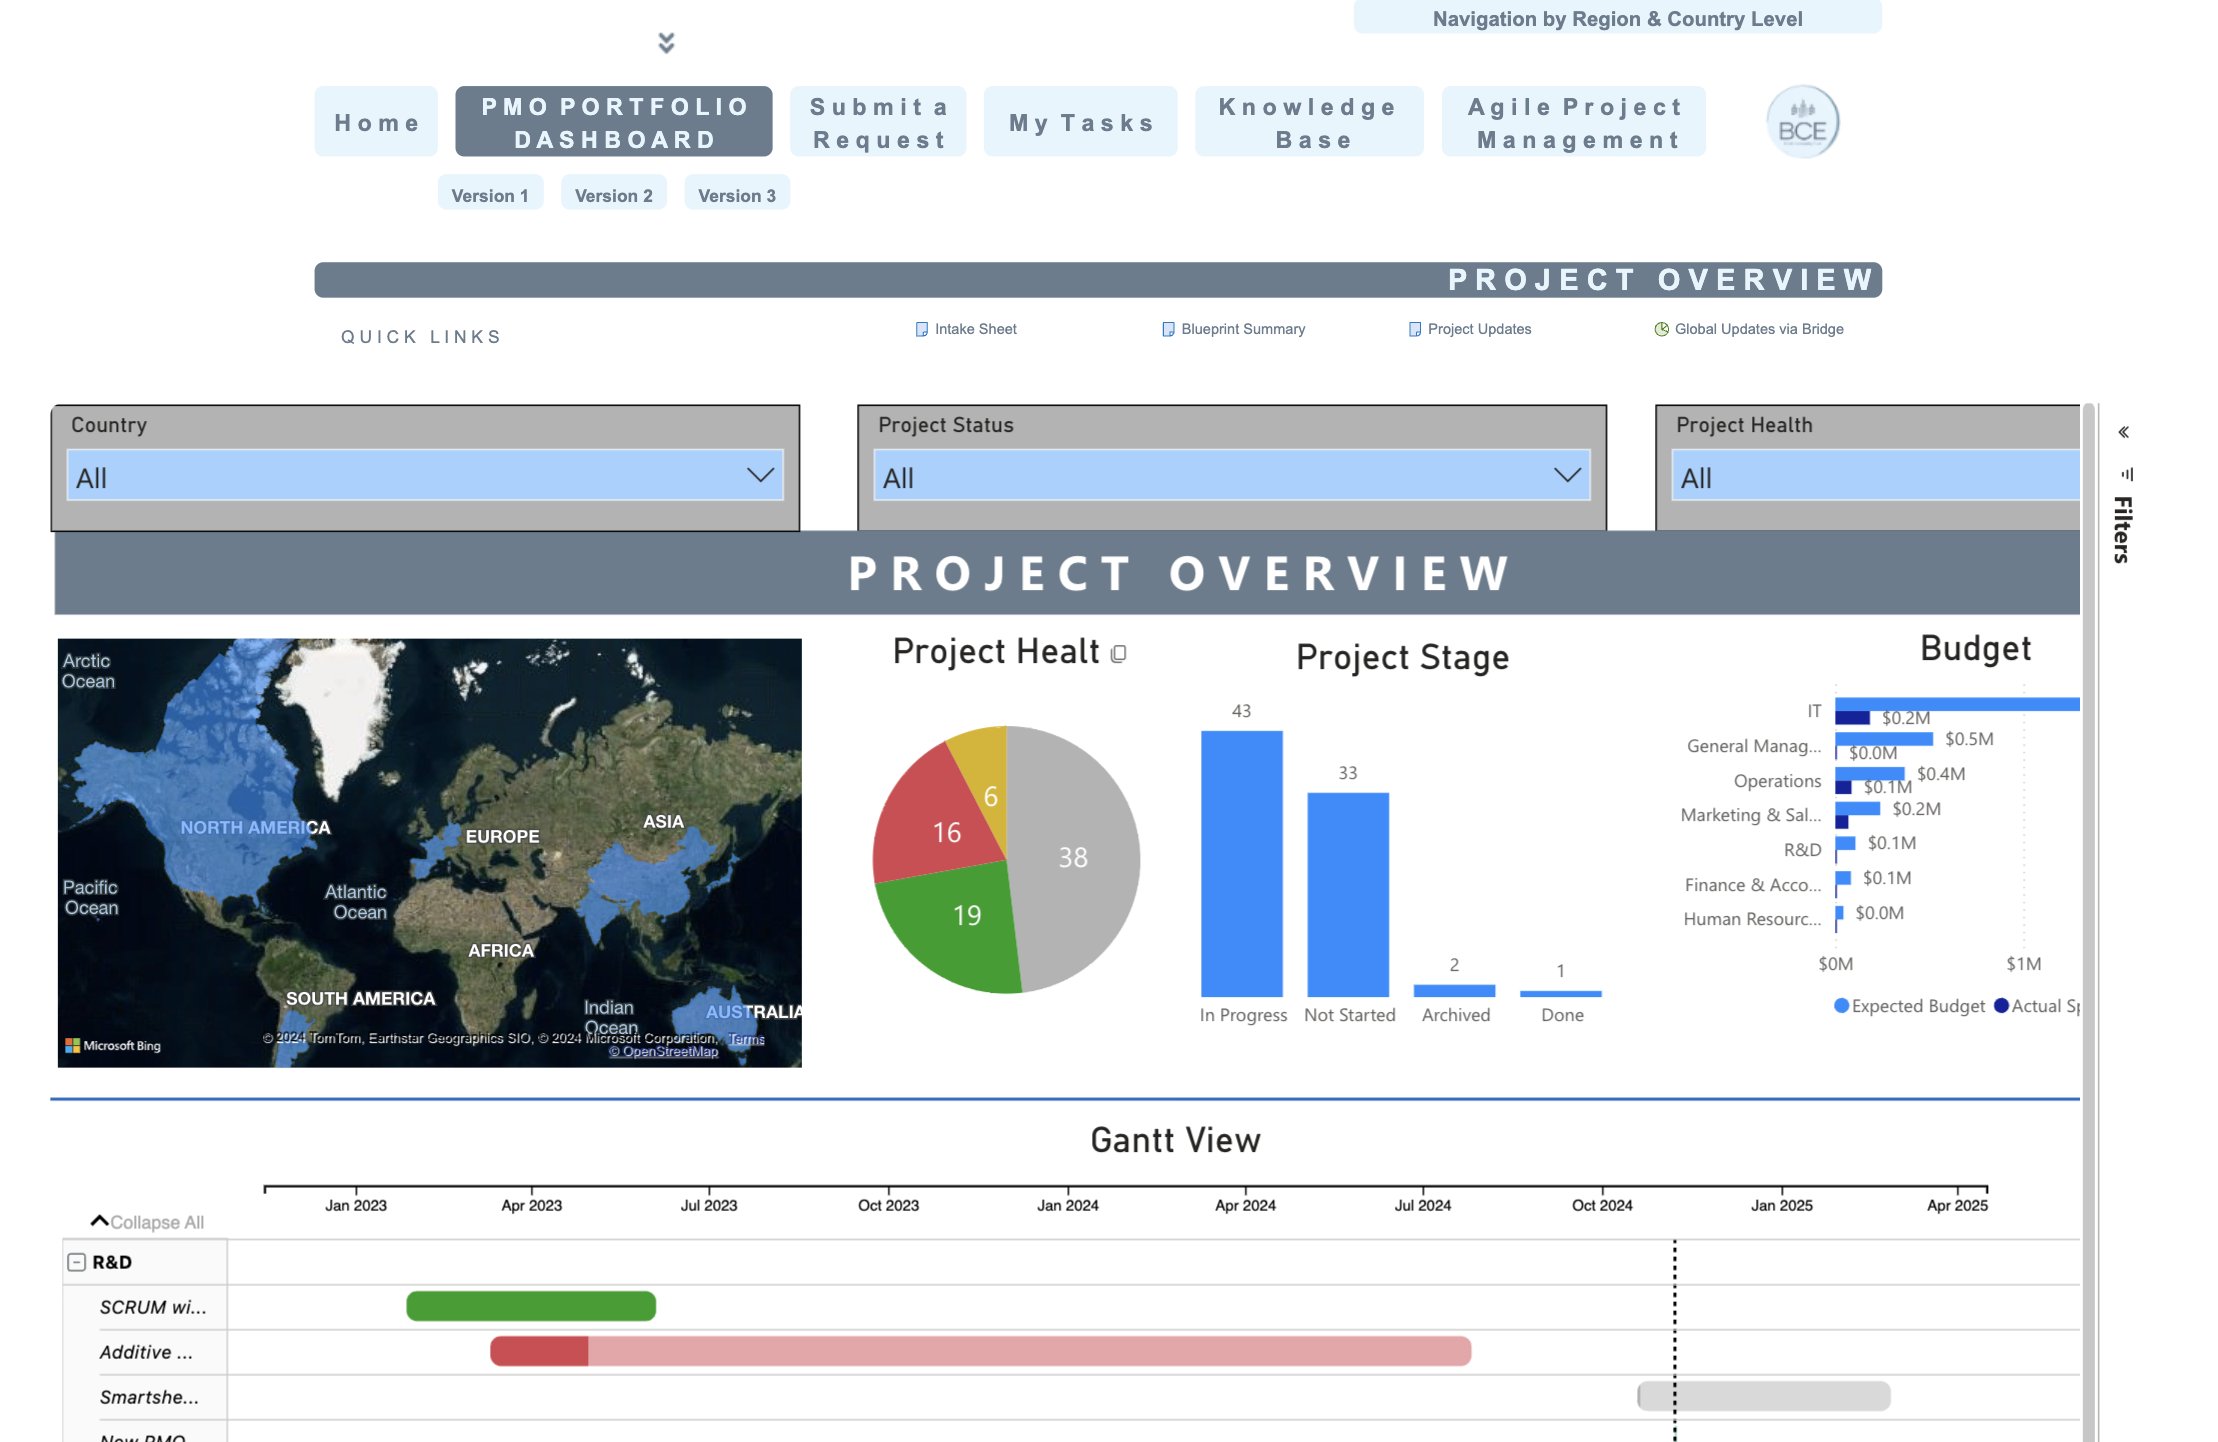
When companies integrate Smartsheet with Power BI, they gain a powerful tool for improved project oversight. This integration offers a unified view of project data, allowing teams to detect potential risks, issues, and roadblocks early on. Identifying these obstacles in advance means teams can act proactively, preventing small issues from turning into costly delays. In addition, access to comprehensive project insights enables stakeholders to make timely, well-informed decisions, leading to better outcomes overall. Moreover, this solution also allows project managers to allocate resources more efficiently, ensuring that teams stay on track and within budget. As a result, enhanced project oversight keeps projects aligned with organizational goals and paves the way for successful, on-scope project completions.
In other words, the Smartsheet and Power BI integration significantly expands the capabilities of the Smartsheet dashboards, offering a deeper level of data analysis and interactivity. The Power BI elements enable project managers to assess project health across multiple dimensions, for instance, monitor budget distribution by department, and visually track project timelines with the Gantt chart, making it ideal for teams needing comprehensive project oversight.
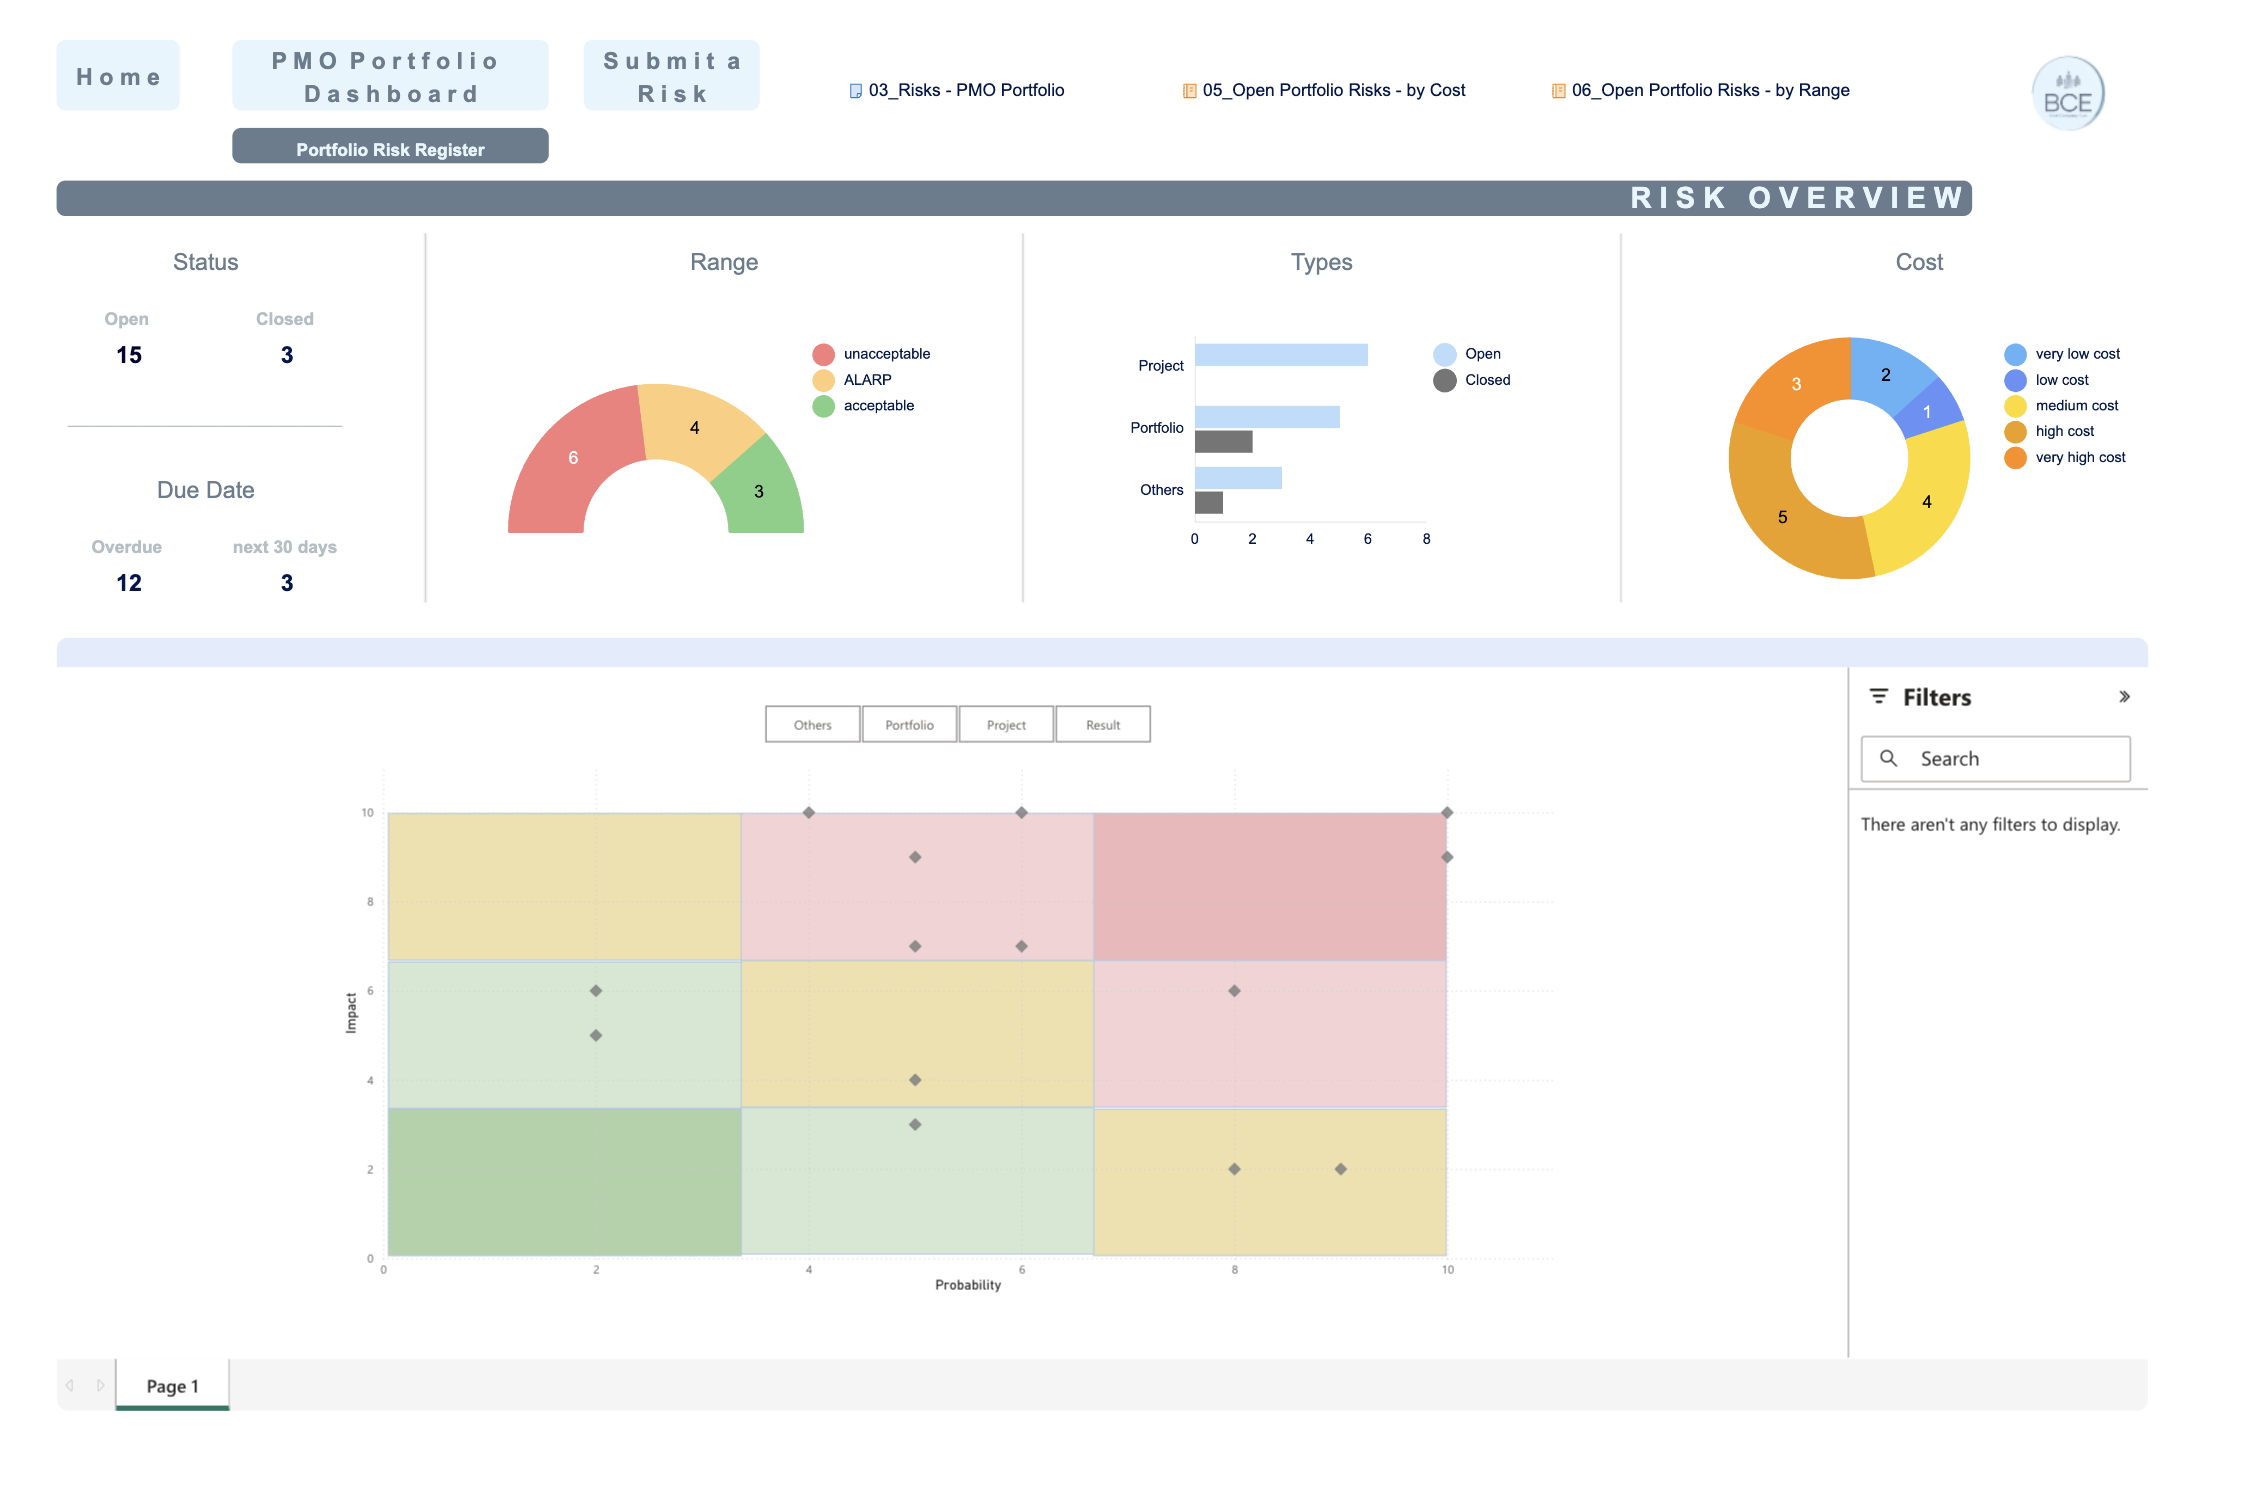
Risk Matrix
For organizations juggling multiple projects, AMX has developed a portfolio-level risk matrix through the Smartsheet and Power BI integration. This risk matrix provides a consolidated, real-time view of risks across the entire project portfolio. By visualizing these risks within Power BI, teams can quickly spot potential threats and take proactive steps to address them before they escalate. The risk matrix also improves operational efficiency by streamlining risk assessment processes, allowing organizations to make quick, informed decisions. With this tool, companies can handle risk analysis more effectively, minimizing the likelihood of unforeseen issues that could disrupt timelines and budgets.Smartsheet can effectively track risks and organize data, but Power BI enhances this capability with advanced filtering, rich visualizations, and interactive elements, empowering teams to analyze and respond to risks more swiftly and efficiently.
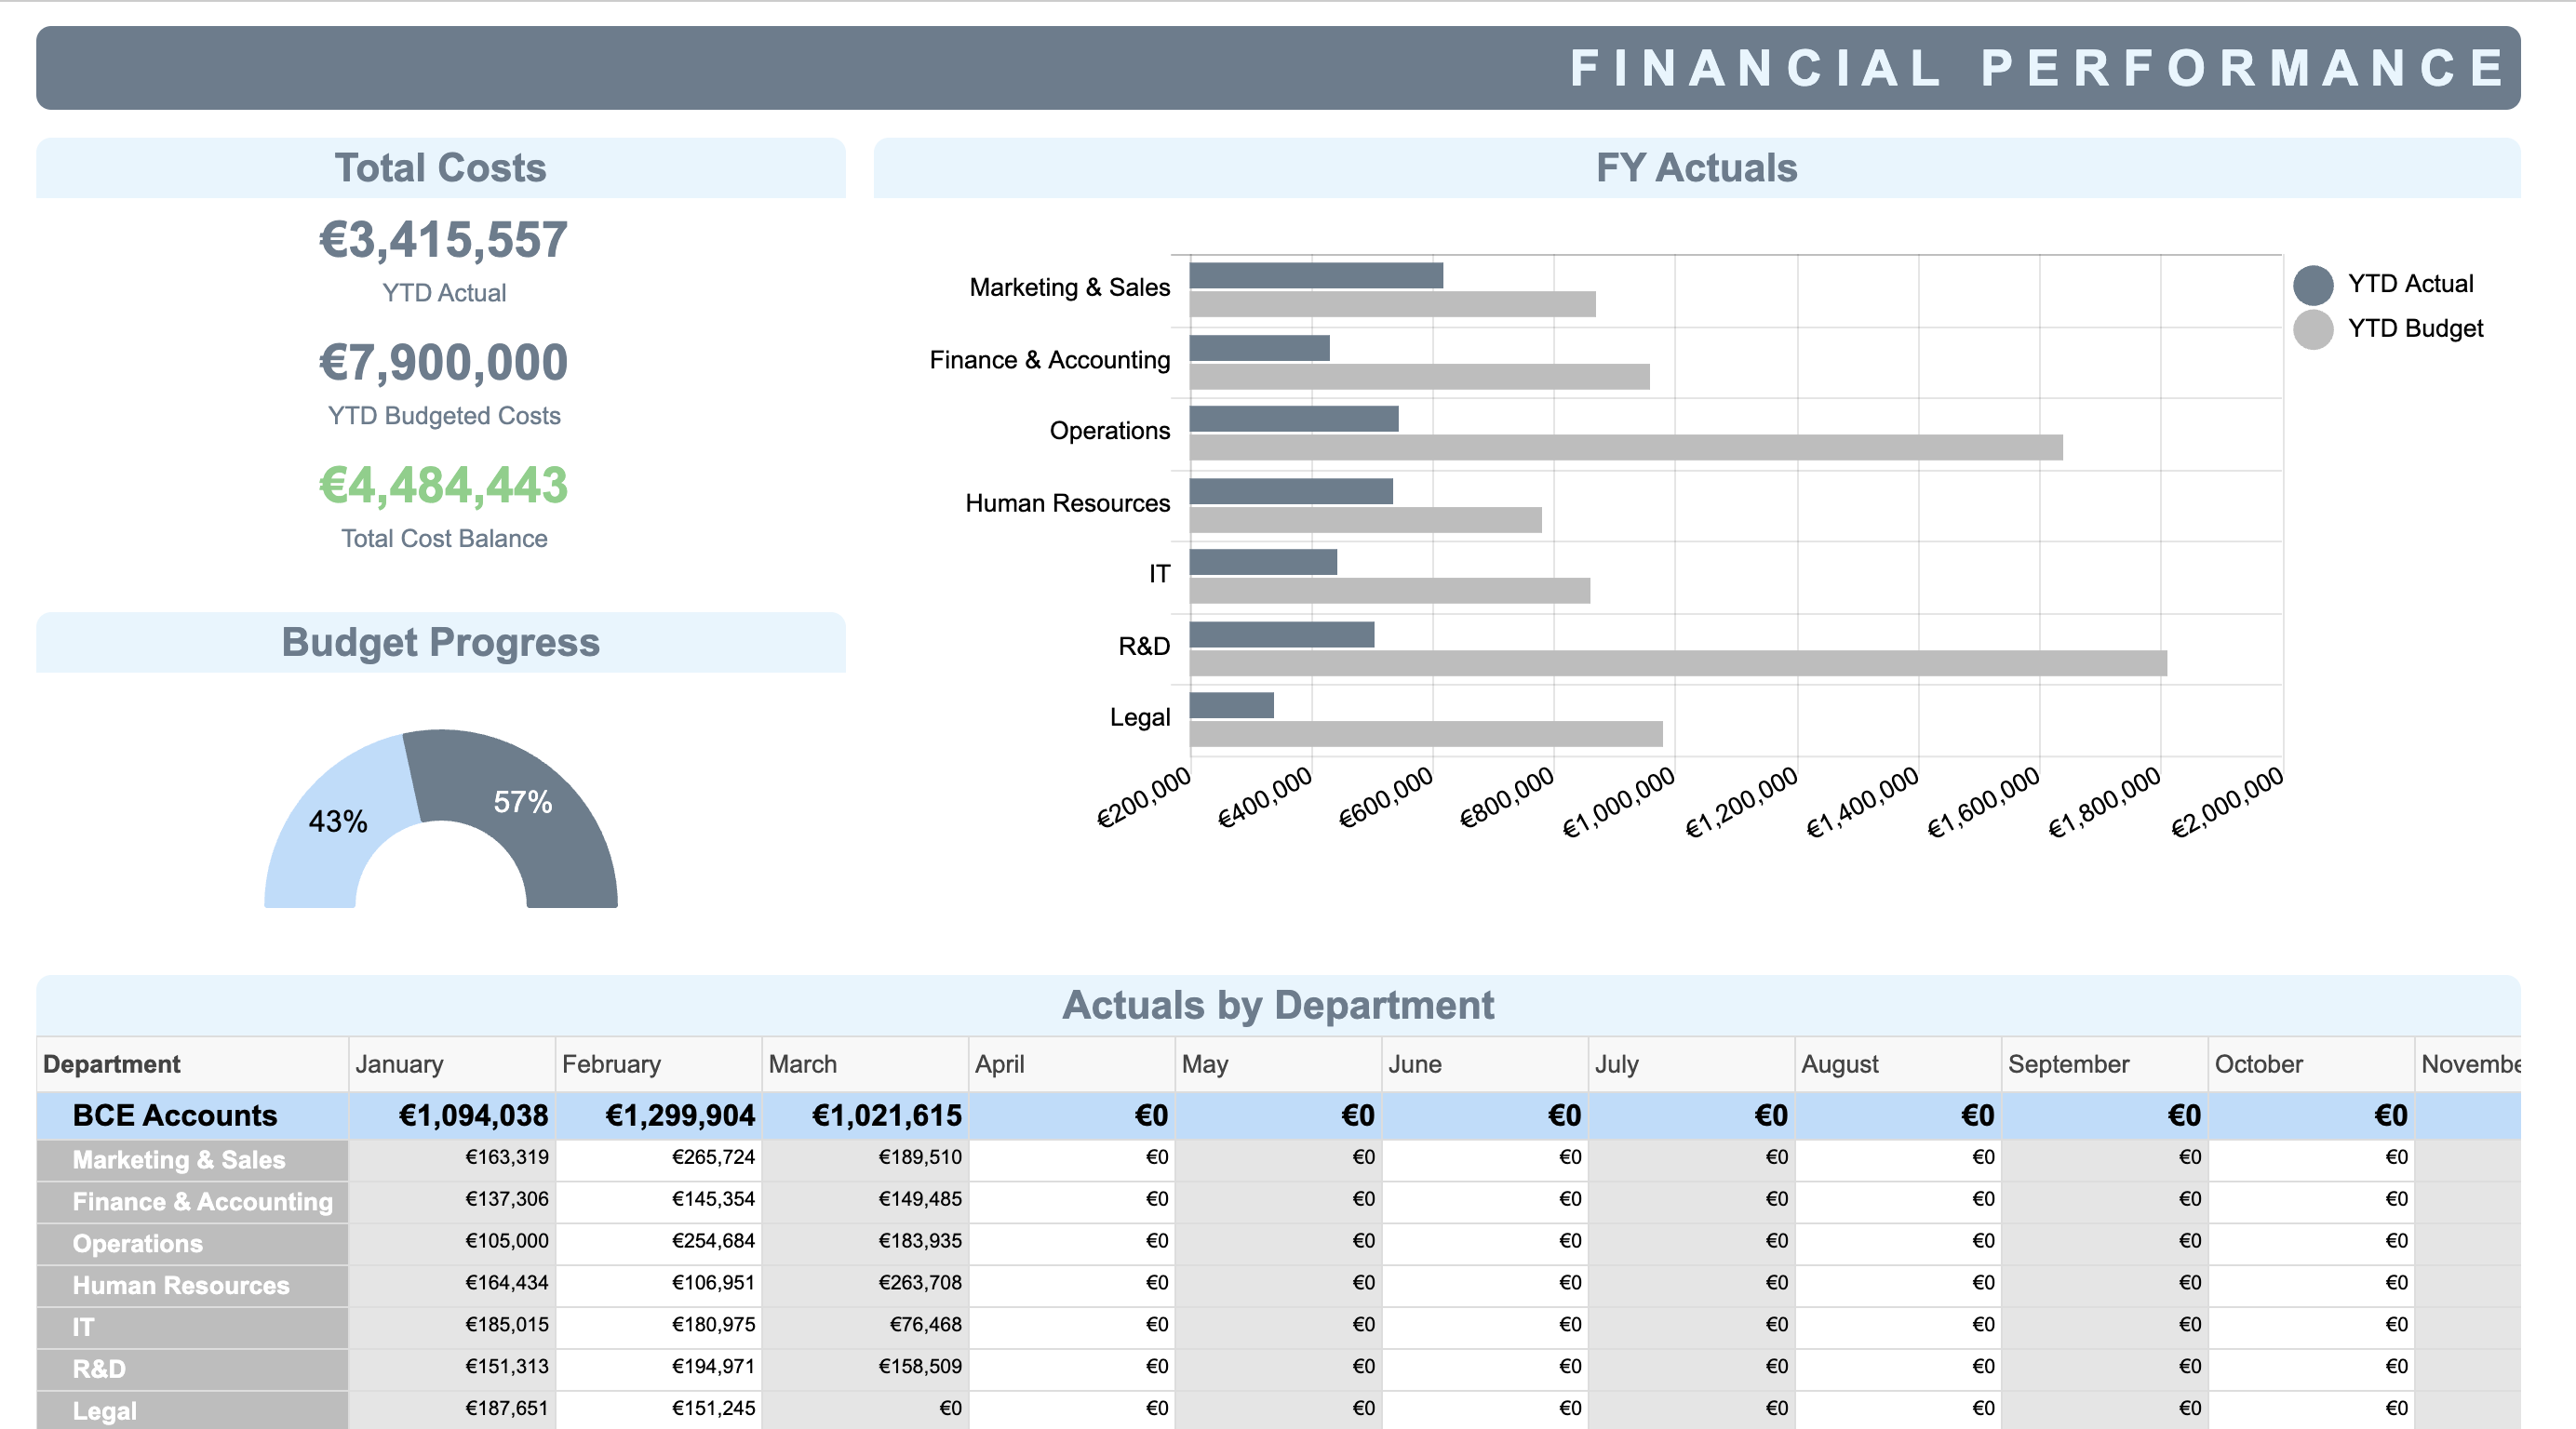
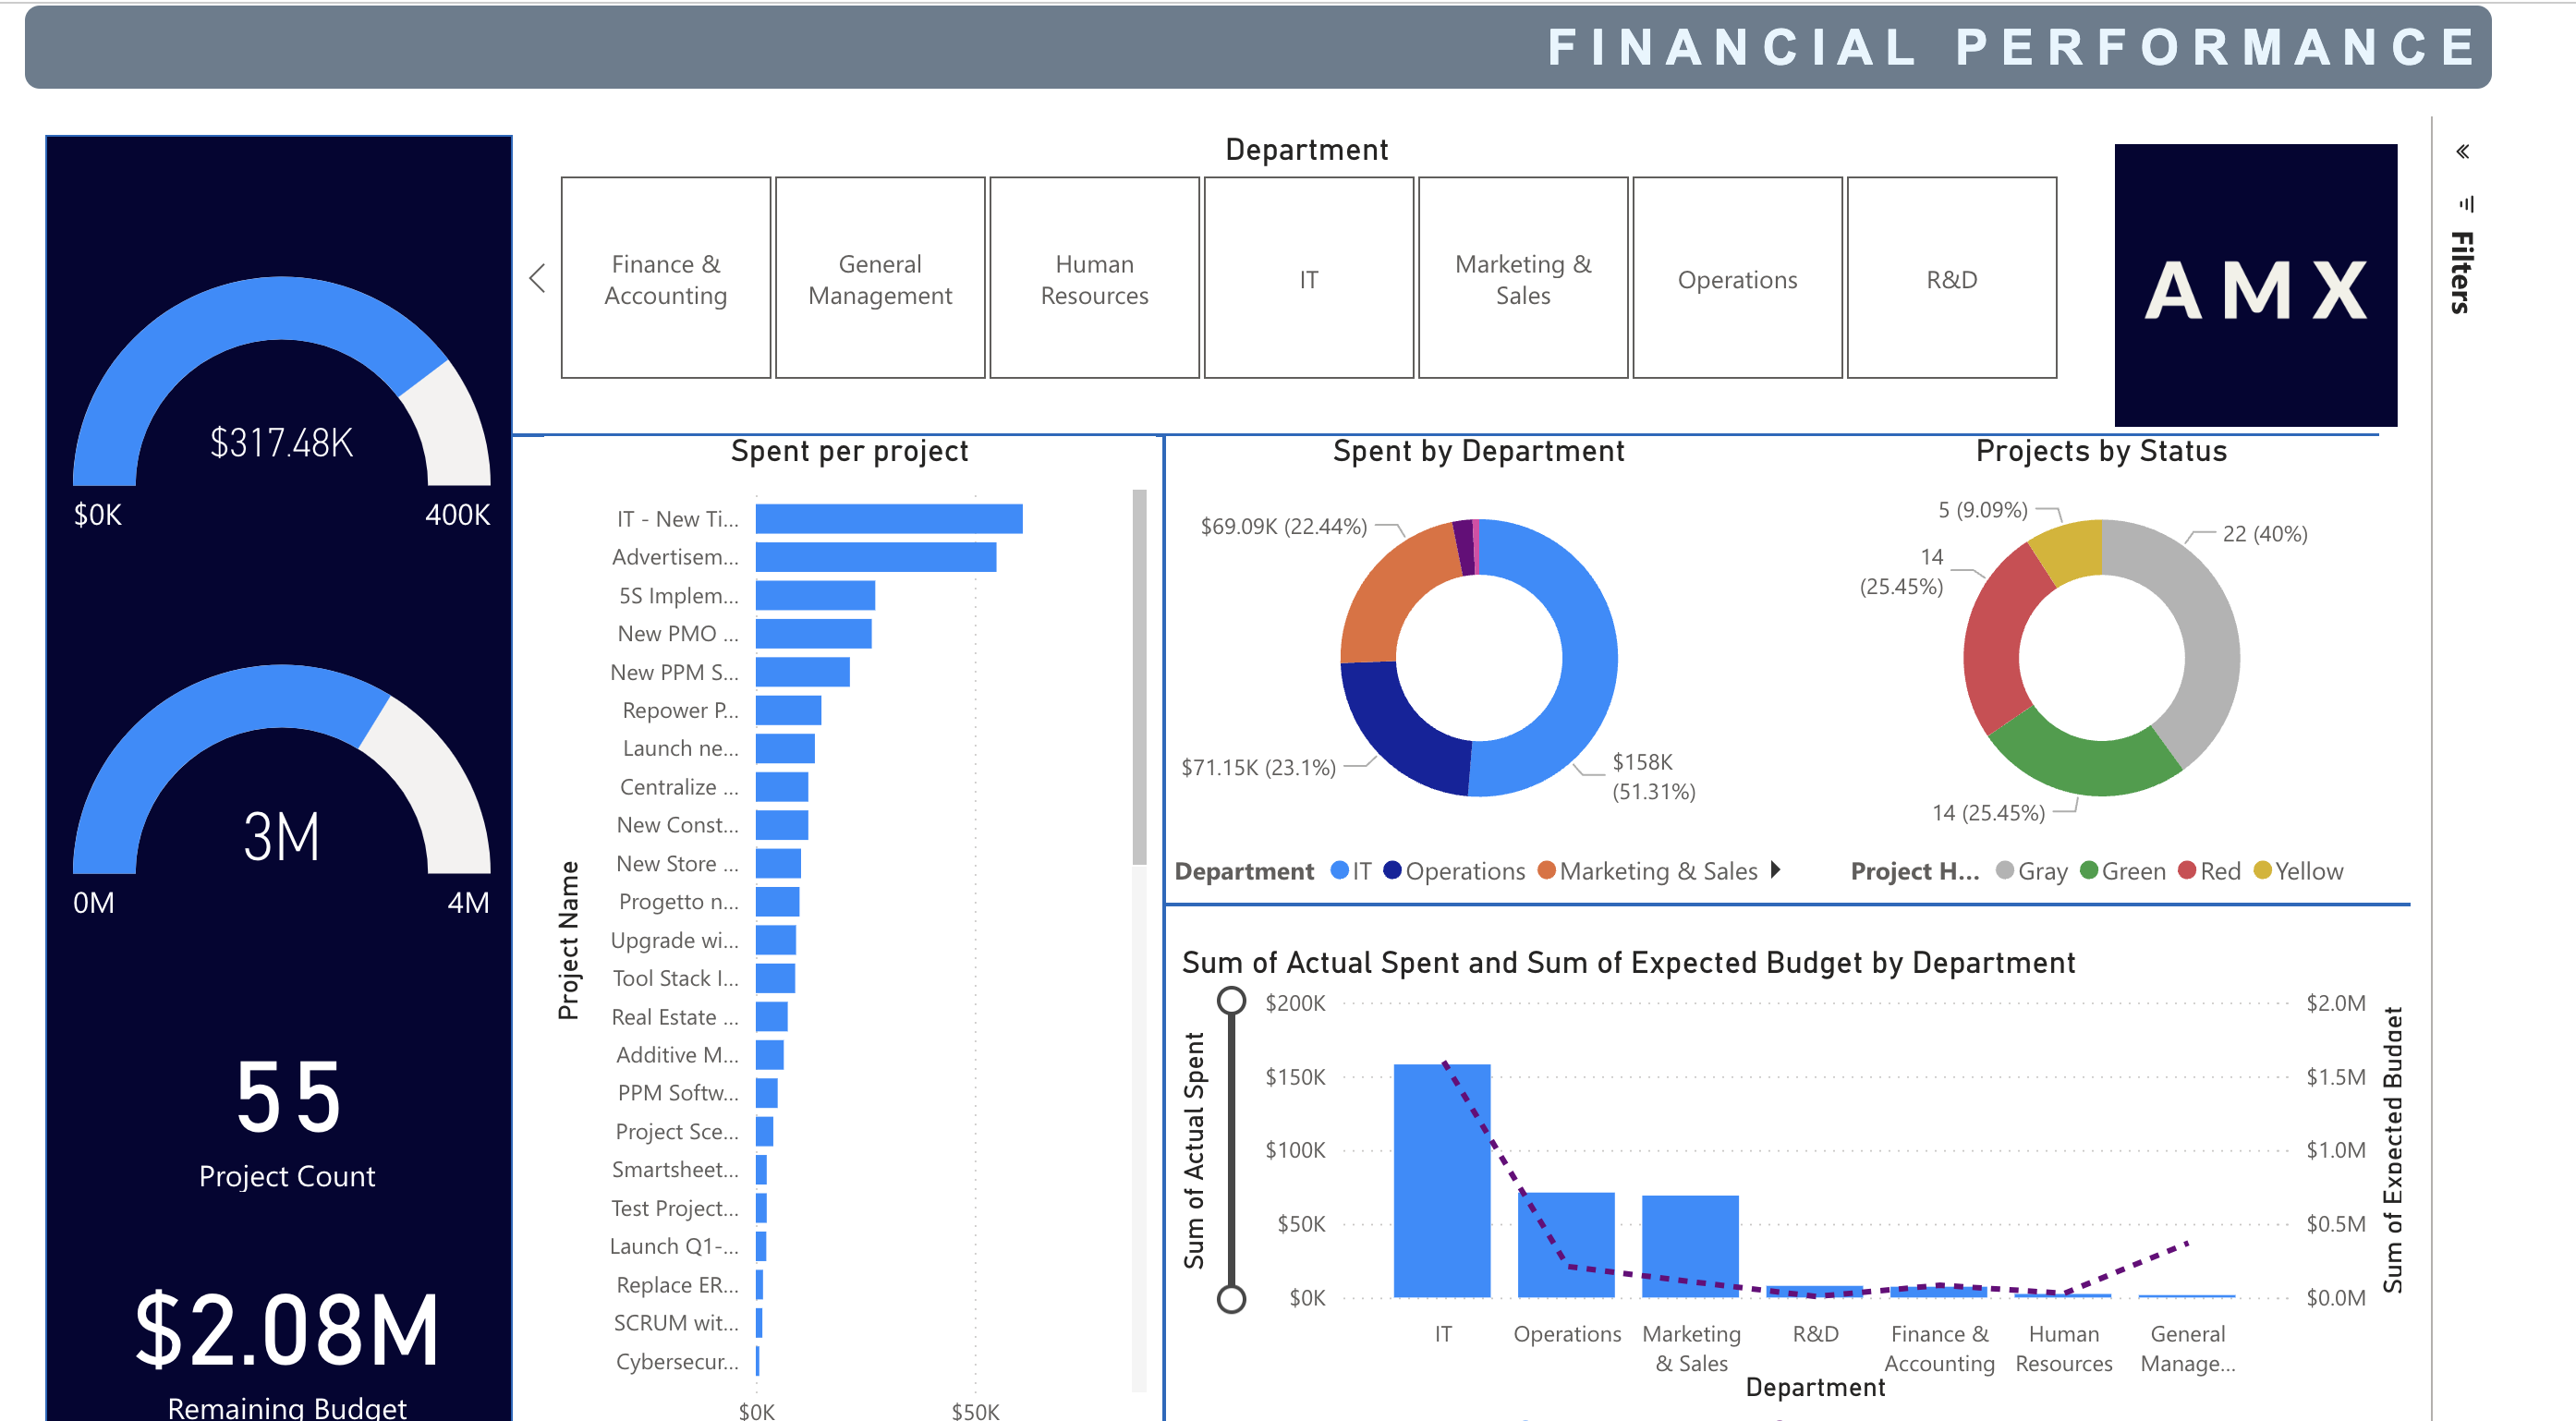
Financial Insights and Efficiency
In addition to project management benefits, integrating Smartsheet with Power BI offers substantial advantages for financial oversight. This integration enables real-time monitoring of budgets, expenses, and forecasts, ensuring financial transparency across all projects. With this insight, organizations can make agile financial decisions, adapting quickly to any budgetary changes. By consolidating financial data across projects, teams can ensure resource allocation is managed properly, reducing overspending and improving adherence to budget targets. Enhanced financial reporting capabilities allow users to customize and explore data through interactive graphs and filters, simplifying trend analysis and enabling quick corrective actions. Moreover, automating data consolidation and reporting reduces manual errors, saving time and increasing operational efficiency in financial management.
Smartsheet and Power BI: A Seamless Integration
The integration between Smartsheet and Power BI allows users to visualize and analyze Smartsheet data within Power BI’s powerful analytics platform. Here’s how it works:
Data Importing: Users can easily add data from Smartsheet into Power BI by selecting relevant sheets and data points. This data is then accessible in Power BI’s robust environment, where it can be transformed and visualized in a variety of ways.
Embedded Dashboards: After creating the necessary visualizations in Power BI, users can embed these directly into Smartsheet dashboards. This capability allows organizations to keep all team members aligned with real-time insights, accessible within their Smartsheet workspace.
Enhanced Visualization Options: With Power BI, Smartsheet users gain access to advanced filtering, drill-downs, and customized visuals that can display project status, financial insights, risk matrices, and more. These options allow for deeper analysis and insights that might not be as easily achievable within Smartsheet alone.
In conclusion, integrating Power BI with Smartsheet creates a powerful platform for comprehensive data management, advanced visualization, and actionable insights. This solution provides organizations with a unified view of their data, enabling real-time analysis and more informed decision-making. At AMX, we offer more than just technical integration—we deliver a tailored approach that addresses each client’s unique needs. Our expertise in Smartsheet establishes a strong foundation, while our experience with data connections ensures seamless data handling across platforms. Finally, our Power BI capabilities deliver advanced visuals and data-driven insights, empowering teams to streamline processes, gain insights from a single connected platform, and foster a data-driven culture. Whether for project management, risk assessment, or financial oversight, this integration equips organizations with the tools and insights they need to navigate today’s complex business landscape with confidence
References
McKinsey Global Institute. (2011, May). Big data: The next frontier for innovation, competition, and productivity. McKinsey & Company. Retrieved from https://www.mckinsey.com/~/media/mckinsey/business%20functions/mckinsey%20digital/our%20insights/big%20data%20the%20next%20frontier%20for%20innovation/mgi_big_data_exec_summary.pdf
Oracle. (2024). Top data analytics challenges. Oracle. Retrieved from https://www.oracle.com/de/business-analytics/data-analytics-challenges/
PwC. (2016). Making strategic decisions: A PwC global data and analytics survey. PwC. Retrieved from https://www.pwc.com/ee/et/publications/pub/pwc-making-strategic-decisions.pdf
Psico Smart. (n.d.). Data-driven decision-making: Leveraging analytics for organizational growth. Retrieved from https://psico-smart.com/en/blogs/blog-datadriven-decision-making-leveraging-analytics-for-organizational-growth-167775
Stobierski, T. (2019, August 26). The advantages of data-driven decision-making. Harvard Business School Online Blog. Retrieved from https://online.hbs.edu/blog/post/data-driven-decision-making